Background to this page
Over a period of years I have performed countless hours of data analysis and trials on Australian
Lotto gaming.
I have found some interesting results including the ability to significantly enhance your odds.
This is possible by the use of several commercially available lotto software applications in conjunction with
a process I have personally created derived from findings which the author of one of those packages
presents in her books.
In brief, my findings (relating specifically to Australian Gold Lotto) are these;
- At certain intervals, I can regularly pick between 5 and 7 of the 8 numbers while using only 23 of the possible 45 numbers !
- The numbers follow one of two major trends, - "Future" or - "Continuing"
- I can predict with a useful degree of accuracy, if the forthcoming week's numbers will be in the "Future Trend" group of numbers or the "Continuing Trend" group of numbers
- The numbers occur more frequently in the "Continuing Trend" group in cycles over many months (years even !).
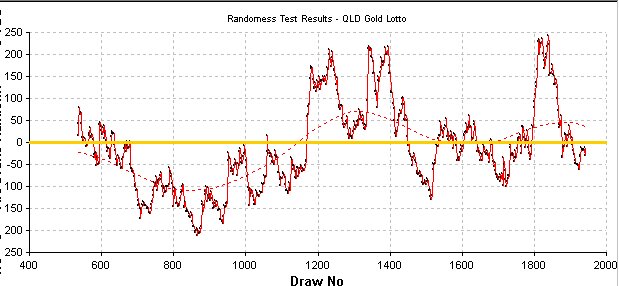
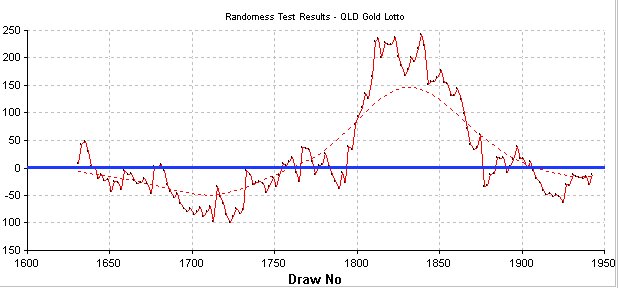
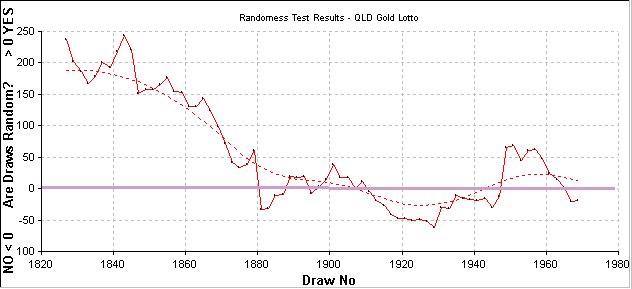
- Using a "Randomness Analysis" funtion within Aureole Electronic's "Lotto Factory" software package, it is possible to determine if the numbers are going to be more predictable (less random) and therefore falling more frequently in the "Continuing Trend" grouping
Try
"Lotto Factory" today !

- When the numbers are regulary occuring in the "Continuing Trend" group, use of my personally developed number selection application can further significantly enhance my odds.
- When the numbers are regulary occuring in the "Continuing Trend" group, I've averaged returns slightly in excess of expenditure over several months.
- When the numbers are not regulary occuring in the "Continuing Trend" group, I've been lucky to average returns of more than 46% of expenditure !
- My Number Selection application is written in good-old Microsoft Excel !
It applies principles described by Gail Howard the author of the SmartLuck lotto software which I find valuable,
blends my findings regarding Future/Continuing Trend cycles, blends the Randomness prediction results, uses some
pattern-matching techniques and regularly provides between 5 and 7 of the 8 numbers using as few as 19 of the 45 numbers !
Try
"Smart Luck" today !

 Return to the top of the document
The unfortunate part to all this is that I discovered much of this information (through regressive analysis) as the randomness analysis was dropping into one of the "more random" cycles, so I am currently reduced to using about 22 of the 45 numbers and achieving between 3 and 6 of the 8 numbers on a regular basis.
 28th March 2000
For FORTY-THREE weeks now from Draw #1839 to Draw #1925, the "WinLotto 98" randomness graph has been trending consistently DOWNWARDS.
This has again proven my earlier findings correct in-that I have consistently had 4 or more numbers PLUS one or both supps during the preceeding UPWARD trend but almost no success (max 3 numbers INCLUDING supps !) in this last downward trend.
It looks as if it may have started to trend upward once again so lets again see what happens if the trend has turned.!!
(See the "Randomness Graph" details below)
The catch to all this is that even having reduced the volume of numbers which you have to work with, you still have to wheel them together in the right combination of 4 or better to win a worthwhile prize !!
So far I am still not a wealthy man !!
Quite the contrary in fact !
I would be a LOT more wealthy if I had NOT been playing lotto for the last several years !

I am prohibited from displaying this new option for playing lotto and keeping your costs at a minimum.
For more information ... e-mail me.
Return to the top of the document
Data Analysis
Last updated August 1999
I will periodically update my analysis charts to which I have provided links on this page, in case anyone else is interested.
I have recently purchased the updated version of Gail Howard's software,"Smart Luck Advantage Plus".
Because this version now incorporates much of the selection process found in my spreadsheets through Gail's
"Smart Picks"TM, I am no longer maintaining the spreadsheets.
They are retained here for reference only.
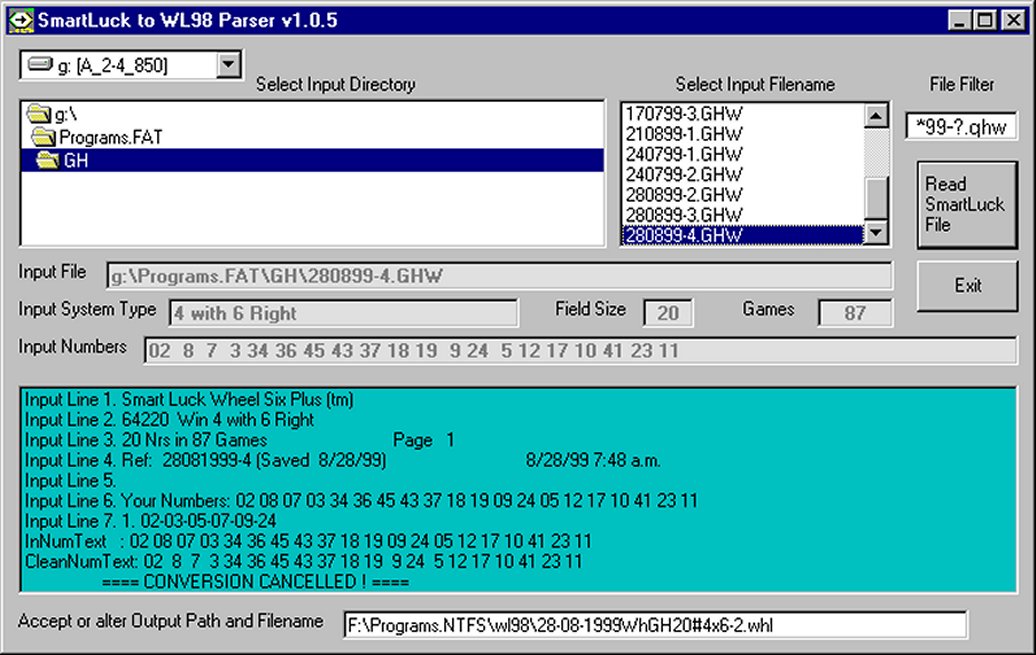
I have instead written a Visual Basic application which takes the output of Gail's "Advantage Plus" program
and re-formats it to the format of the latest Lotto Factory program "WinLotto 98" to allow the use of the more powerful
number-selection and game-optimization processes of Gail's program to be passed on to "WinLotto 98" for it's
superior game-reduction processes and coupon printing abilities.
Some screen-shots of my VB application.
Viewing any of the following spreadsheets is best done,
using Microsoft Excel version 97
NOTE - I last updated any of these in January 1999
[NOTE:]
[Personal observation in relation to Australian Saturday Gold Lotto has shown the graph is actually inverted !]
[This is to say, that when the graph plots BELOW the 0 line, numbers are MORE random (less predictable) ]
[while ABOVE the 0 line they are LESS random (more predictable) !]
Return to the top of the document
If you have found this page of interest and either want more information or have information to share, please e-mail me by clicking on this icon.


 Return to Home Page